Measurable Outcomes
Customers report dramatically faster reporting cycles and measurable portfolio uplift.
Faster Reporting
Cycles reduced by up to 50%
Portfolio Uplift
NOI uplift of 6%
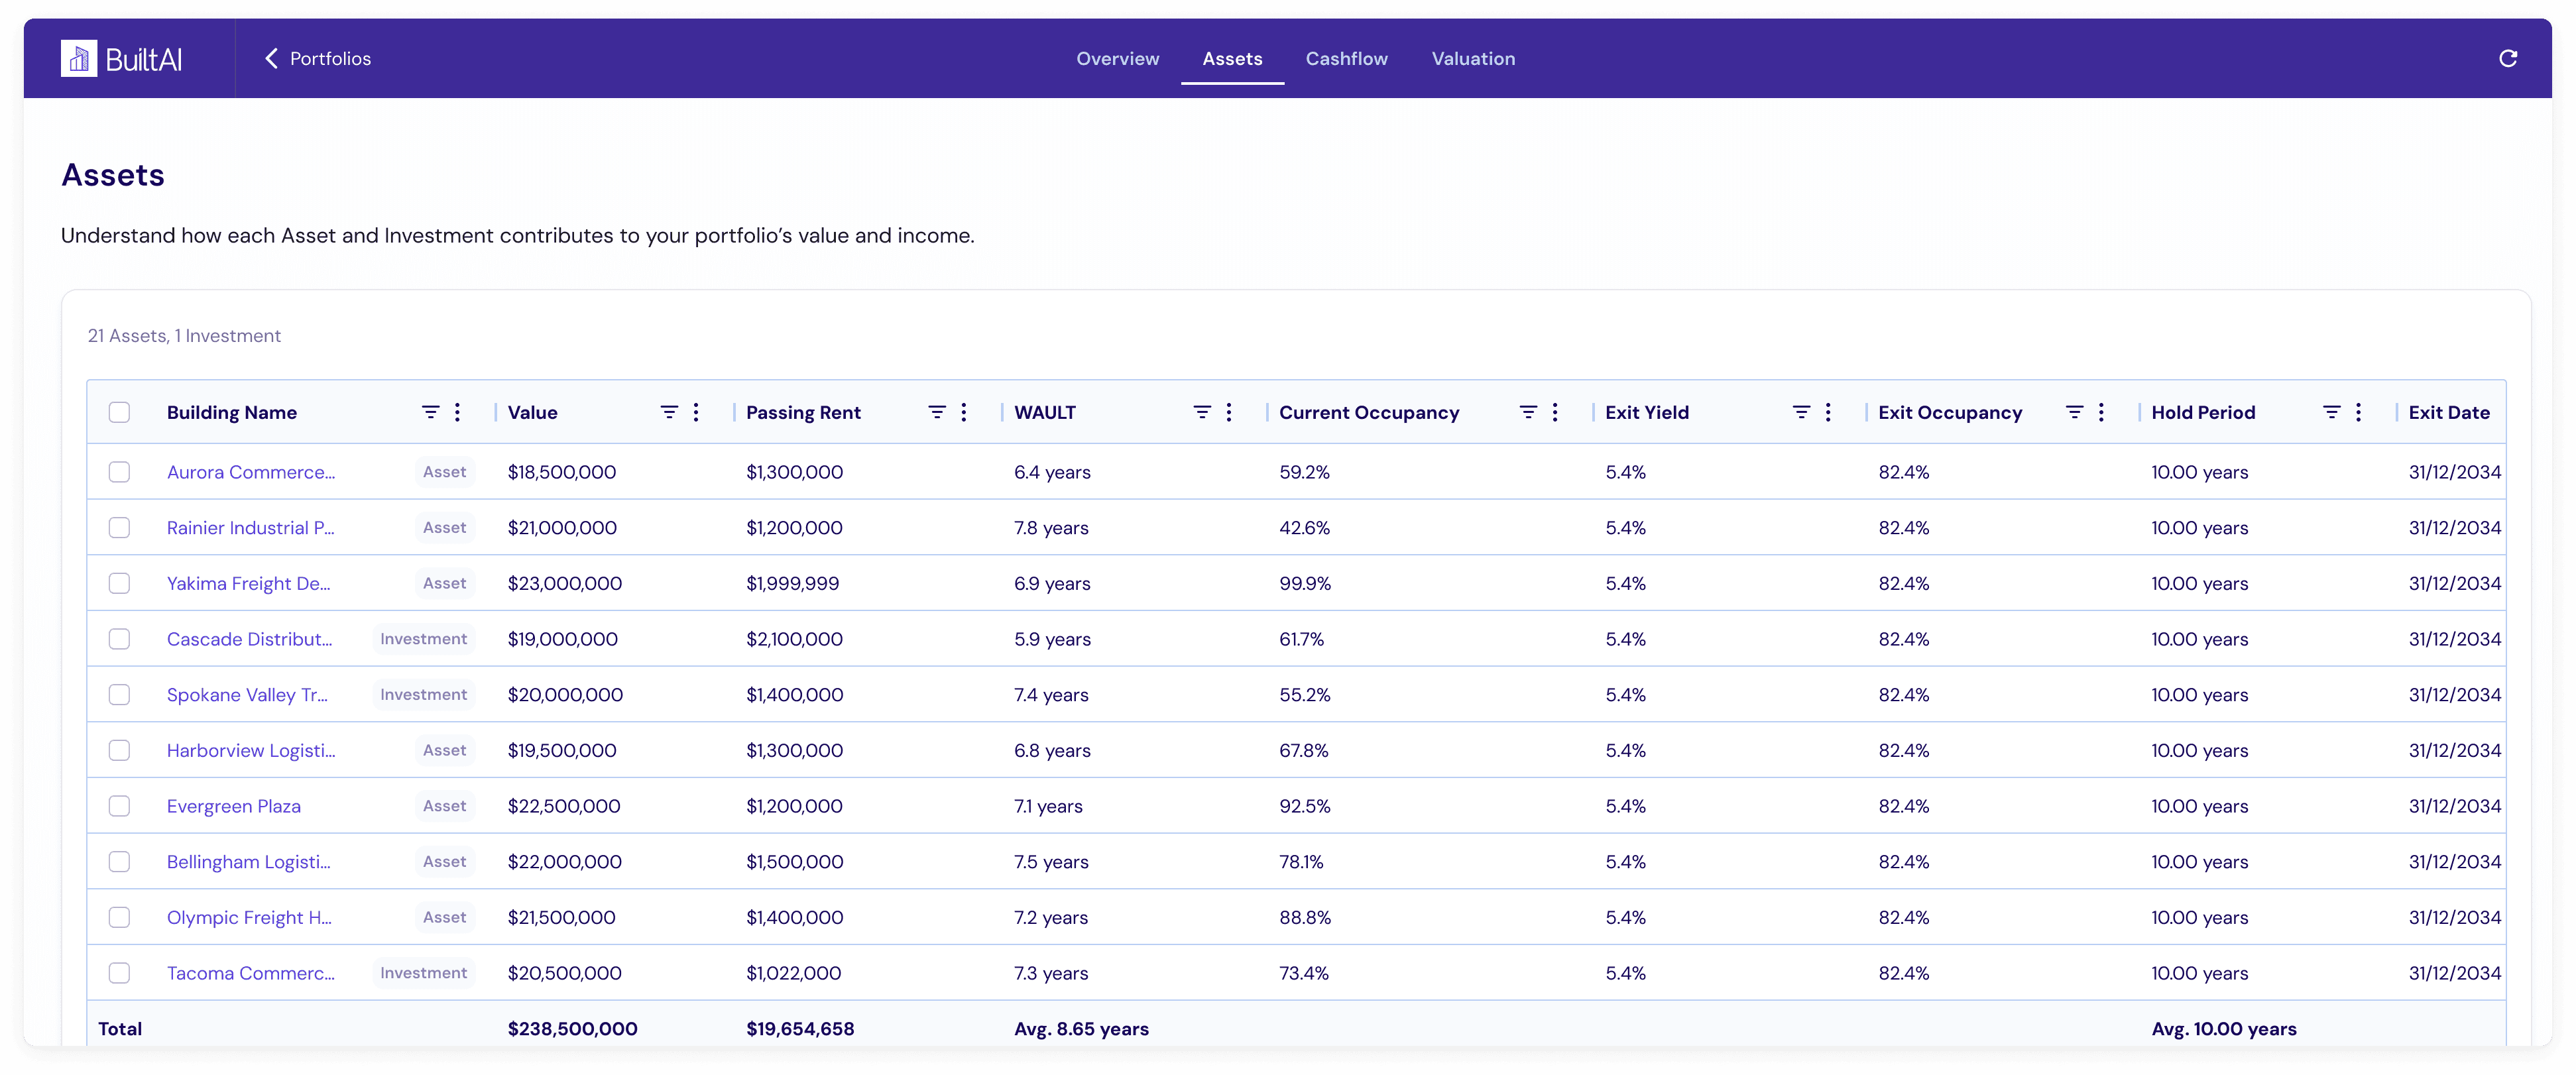
Asset & Portfolio Management
Portfolio management brings all assets together into one trusted model for portfolio-level decisions. Built AI automatically aggregates existing assets and potential acquisitions and provides instant drill-down analysis from unit cash flows to portfolio impact. The result is clear visibility into risks and value drivers, enabling more impactful decisions.


Solutions
Our AI-driven platform addresses key industry challenges, turning obstacles into opportunities for growth and efficiency.

Real-time portfolio insights enable faster, data-driven decisions.
Limited Visibility
Fragmented Workflows
Time Consuming

Real-time portfolio insights enable faster, data-driven decisions.
Limited Visibility
Fragmented Workflows
Time Consuming

Real-time portfolio insights enable faster, data-driven decisions.
Limited Visibility
Fragmented Workflows
Time Consuming

Real-time portfolio insights enable faster, data-driven decisions.
Limited Visibility
Fragmented Workflows
Time Consuming
Key Features
See how your assets are performing, test future scenarios, and align forecasts with real-world data.
See portfolio overview quickly and drill into any asset.
Identify Underperformers
Model each asset (and unit-level cashflows) to spot assets that significantly impact NOI and returns.
Measure Contribution
Identify concentration risk by geography, tenant, asset class or % of portfolio and identify which assets drive performance.
Integrate with PMS Systems
Pull operating data into one unified operating system for a single source of truth.

Know which assumptions impact returns and by how much.
Compare Assets
Side-by-side scenario comparisons to identify the highest-impact risks and opportunities and focus capital or mitigation where it matters most.
Sensitivity Analysis
Test interest rates, market rent, occupancy, capex, and other assumptions to measure their effects on NOI, valuation, and returns.
Multi-asset Scenarios
Run scenarios across multiple assets (including acquisition/disposition and buy/sell/hold cases) and roll up results to show the aggregate portfolio impact.

Close the loop between forecasts and reality.
Automated Reconciliation
Map rent rolls and actuals to your model to refresh metrics and eliminate manual reconciliation.
Historical Decomposition
See historical performance and surface the past value drivers for each asset and the overall portfolio. Use those insights to inform forecasts and guide future asset plans.
Improve Collaboration
One unified model with transparent data, so teams can easily coordinate.

Customers report dramatically faster reporting cycles and measurable portfolio uplift.
Faster Reporting
Cycles reduced by up to 50%
Portfolio Uplift
NOI uplift of 6%

Make Faster, Smarter Investment Decisions
Trusted by leading real estate investors for speed and precision.


Make Faster, Smarter Investment Decisions
Trusted by leading real estate investors for speed and precision.


Make Faster, Smarter Investment Decisions
Trusted by leading real estate investors for speed and precision.


Make Faster, Smarter Investment Decisions
Trusted by leading real estate investors for speed and precision.
